Welcome. Here we give a brief introduction to the current research at Conformational Search Solutions.
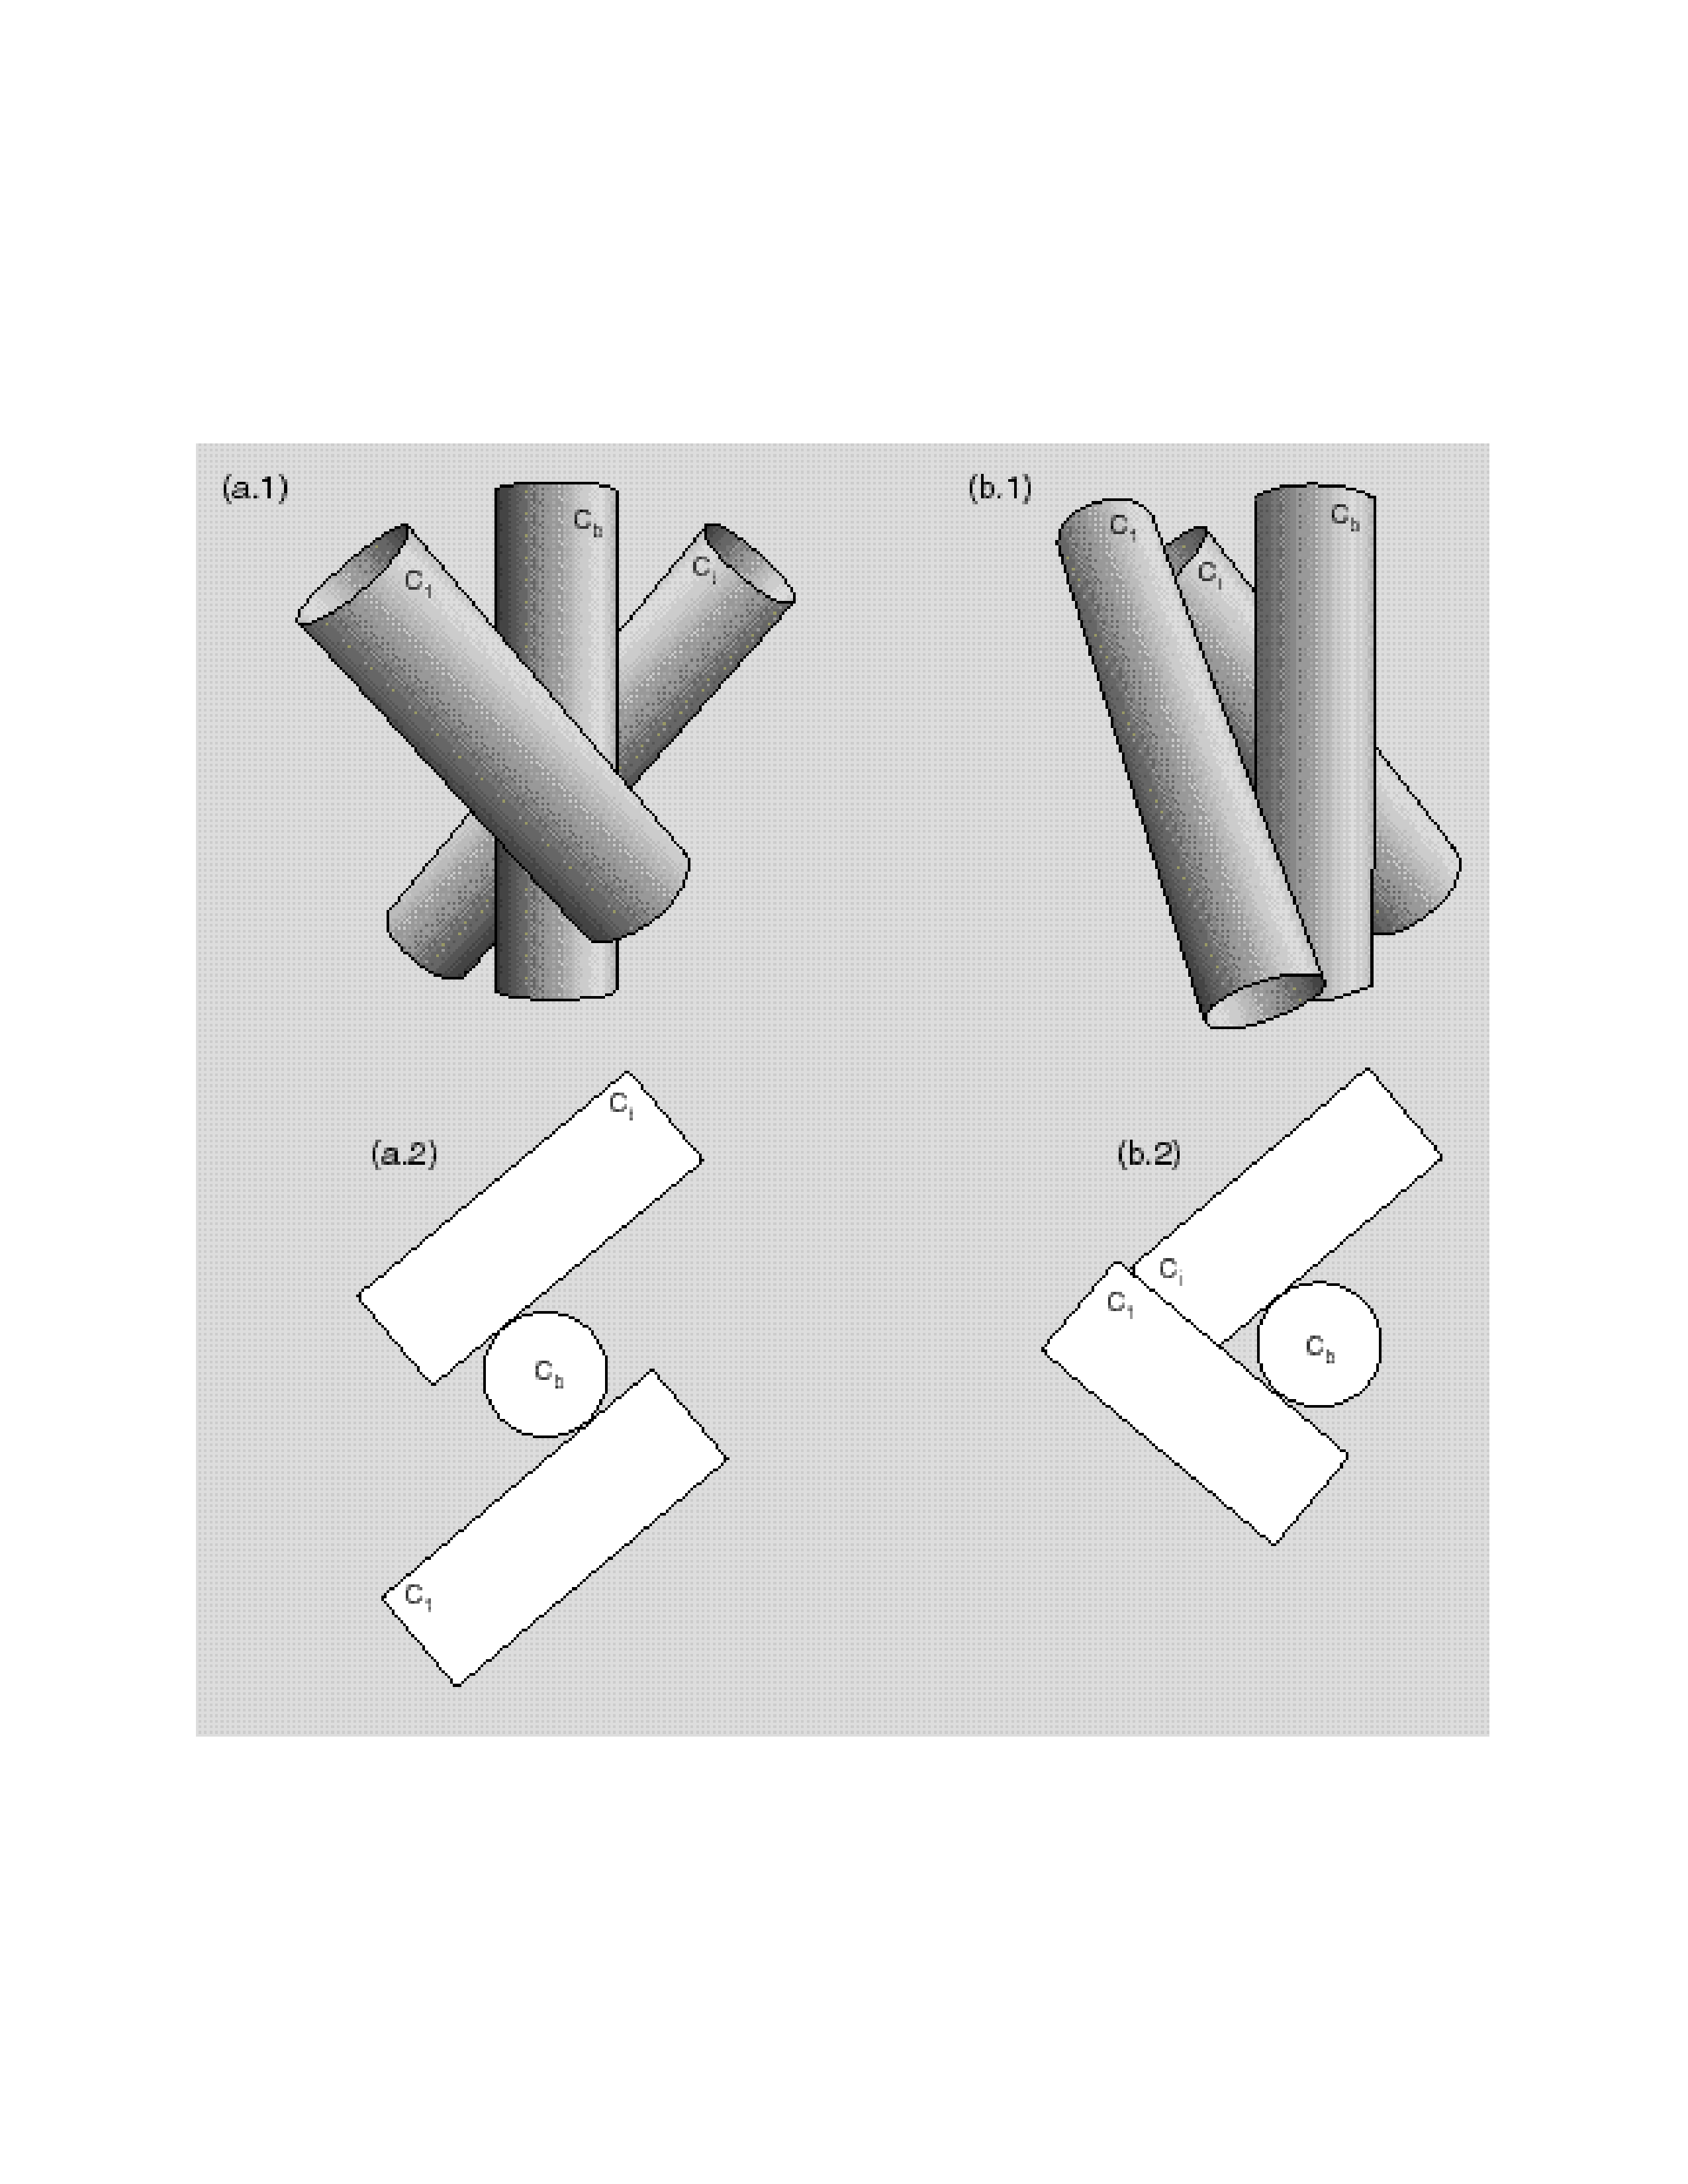
In the past decade, the research has focused on the mechanics of protein folding. It culminated to the hypothesis that the protein structure can be characterized as a stable static equilibrium. We propose that the protein structure is fixated by interlockings between protein secondary structures mainly through the interior nonpolar sidechain interactions.
This working hypothesis is described in detail in the publication “Modeling protein structure as a stable static equilibrium”. (August 2022 issue of Physical Review E, Vol. 106,No. 2) The abstract and figures of the paper can be viewed here (Physical review E website). There are 23 pages in the paper and 49 pages in Supplemental material . The tables of content are provided below:
CONTENTS
I. Introduction 1
II. The Mechanisms of Interlocking 4
A. Molecular forces in a static model of protein structure
B. Blocking, double blocking and mutual blocking
C. Interlocking between two substructures
D. Assembly of substructures on the basis of interlocking
III. Truss Representation of Core Assemblies 8
A. Interlocking represented in a truss
B. Load distribution problem for protein core assemblies
C. Structural strength of core assemblies: failure load
IV. Comparing Interlocking Features of Core Assemblies 10
A. Redundancy in core assembly: duplicate and circular interlocking
B. Concentrated interlocking assembly
C. A longer helix vs. two short helices from the same chain segment
D. Implementations
V. Results in Comparing Core Assemblies 12
A. Various interlocking types and assembly patterns in native structures
B. Comparing assembly features between native structures and decoys
VI. Discussions 17
A. A distinct characteristic of protein structural stability: Compressive support
B. Buckling load of a blocking interaction
C. Stability and determinacy of a core assembly viewed through truss representation
VII. Conclusion 20
CONTENTS Supplemental Material
I. Strength of compressive support: Repulsions between interior nonpolar sidechains 2
II. Gaps on substructures and sidechain sizes 8
III. Instability of blocking action: Simulations of sidechain motions 16
A. Fluctuations of the angles between the vector connecting centroids of two interacting sidechains and a substructure axis 16
B. Fluctuations of the orientations of a sidechain relative to the axis of the substructure 16
IV. Solving load distribution by resolving indeterminacy 17
A. Load distribution at a 2-bar joint of a triangle truss 17
B. Load distribution in an interlocking: Solving a truss with indeterminacy of third degree 20
C. Load distribution in a cross interlocking: Solving a tetrahedron truss 27
D. Load distribution in a core assembly with three substructures 30
E. A demonstration for why a distant bar in a truss may receive less load 34
V. The significance in restricting the axial translational motion 36
VI. The reduction of interlocking force due to a buried unneutralized charged group 38
VII. Comparison of core assembly features 41
A. Core assembly features of beta sheet proteins 41
B. Sensitivity of the core assembly results to parameter value choices 42
C. Pruning decoys on the basis of energetical properties 47
References 49
Presently two lines of research are on-going: (1) a search program is being developed to enumerate likely secondary structure packing patterns based on the interlockings favored by the particular nonpolar-polar compositions of the sequence. (2) a program for calculating structural strength of protein core assemblies is being optimized so that it can be used in practical screening of the above mentioned packing patterns.
In the decade prior (2002–2009), the research is partially funded by NIGMS, under the project titled ”Prioritized Assembly in Protein Conformational Search”. The following is a brief summary of the final report.
Efficient Enumeration of Assemblies
of Protein Secondary Structures
While the apparent simplicity of some protein structures, such as 4-helix bundles and α-β barrels, suggests there might be a simple formulation of the physics involved, the vast diversity in the structural patterns and stabilities hints otherwise.
We propose to investigate protein structures by directly applying the ensemble approach of statistical mechanics. Such an approach could be practical if the partition function can be approximated by enumerating a sufficiently large set of low energy conformations.
A program has been developed for such enumeration. The enumeration scheme is designed so that it is refined in resolution, highly regular for efficient mathematical manipulation yet consistent with the inherent protein geometry.
The program has produced conformations for α,β and α∕β proteins to RMSDs around 3.2A for 100 residues. Singular value decomposition calculations show the conformations are diversely populated.
The Structural Model
The Enumeration Scheme


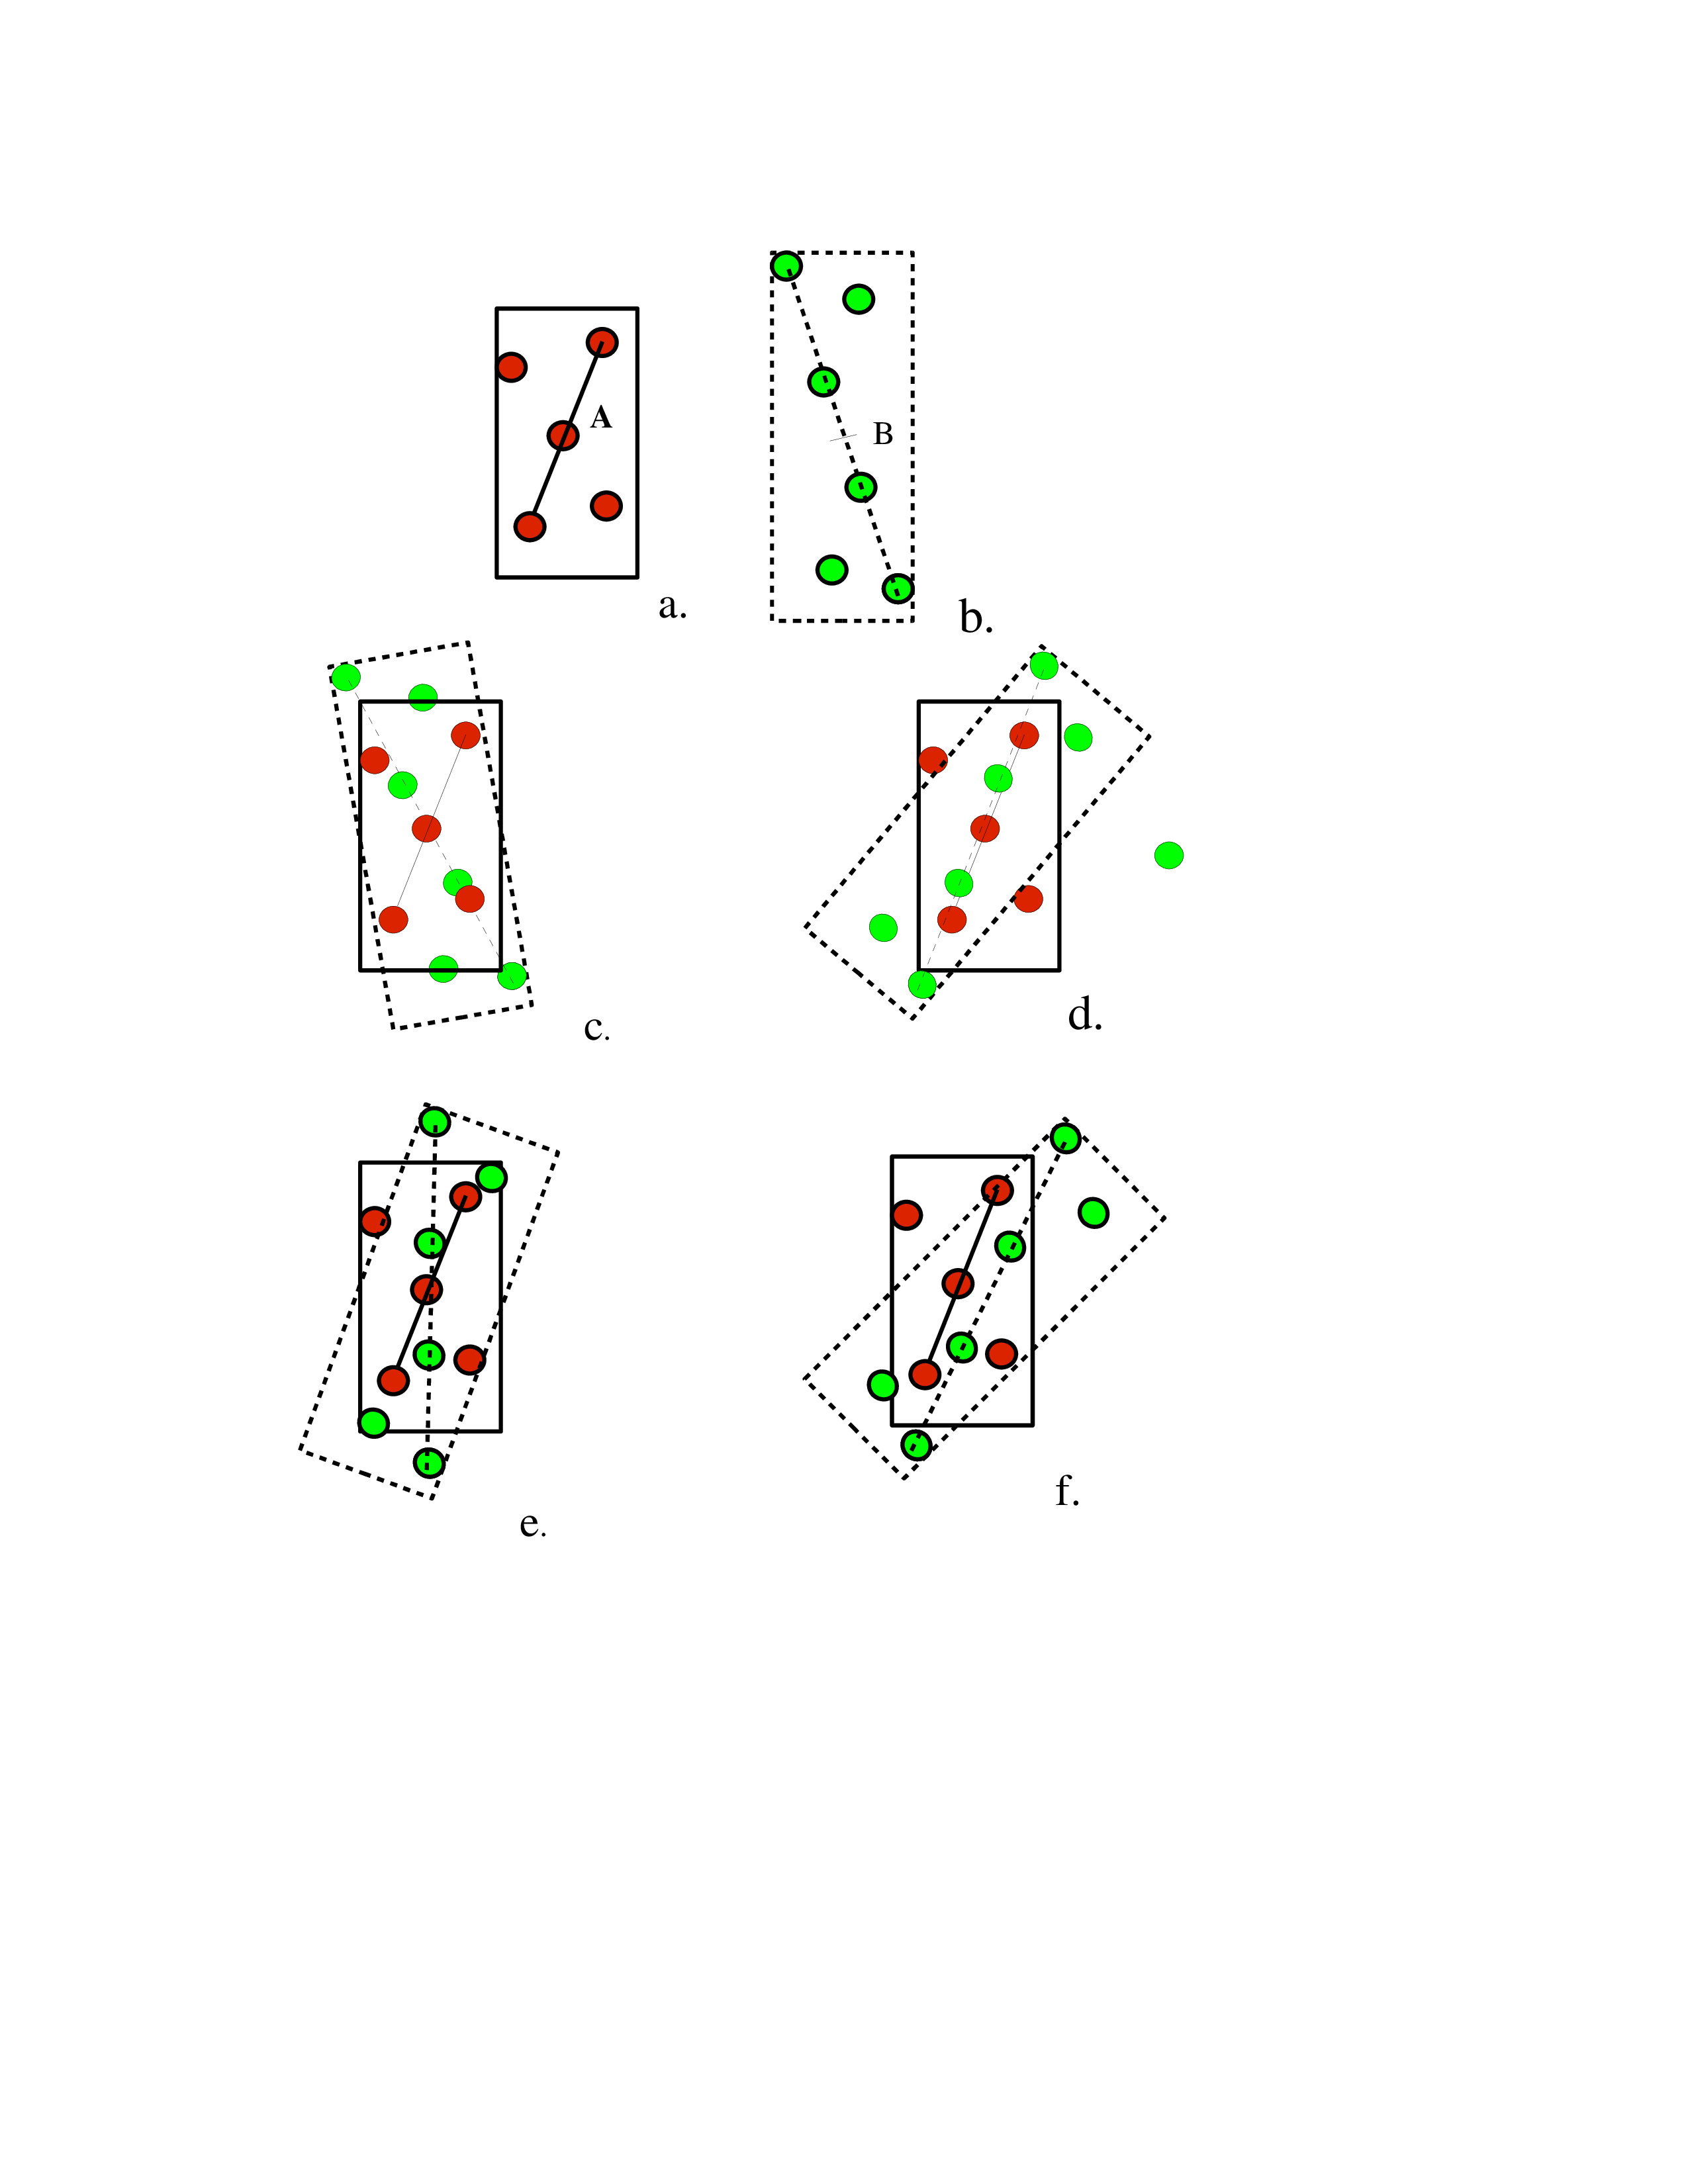
Topological map

Mapping a sequence to assemblies of secondary structures
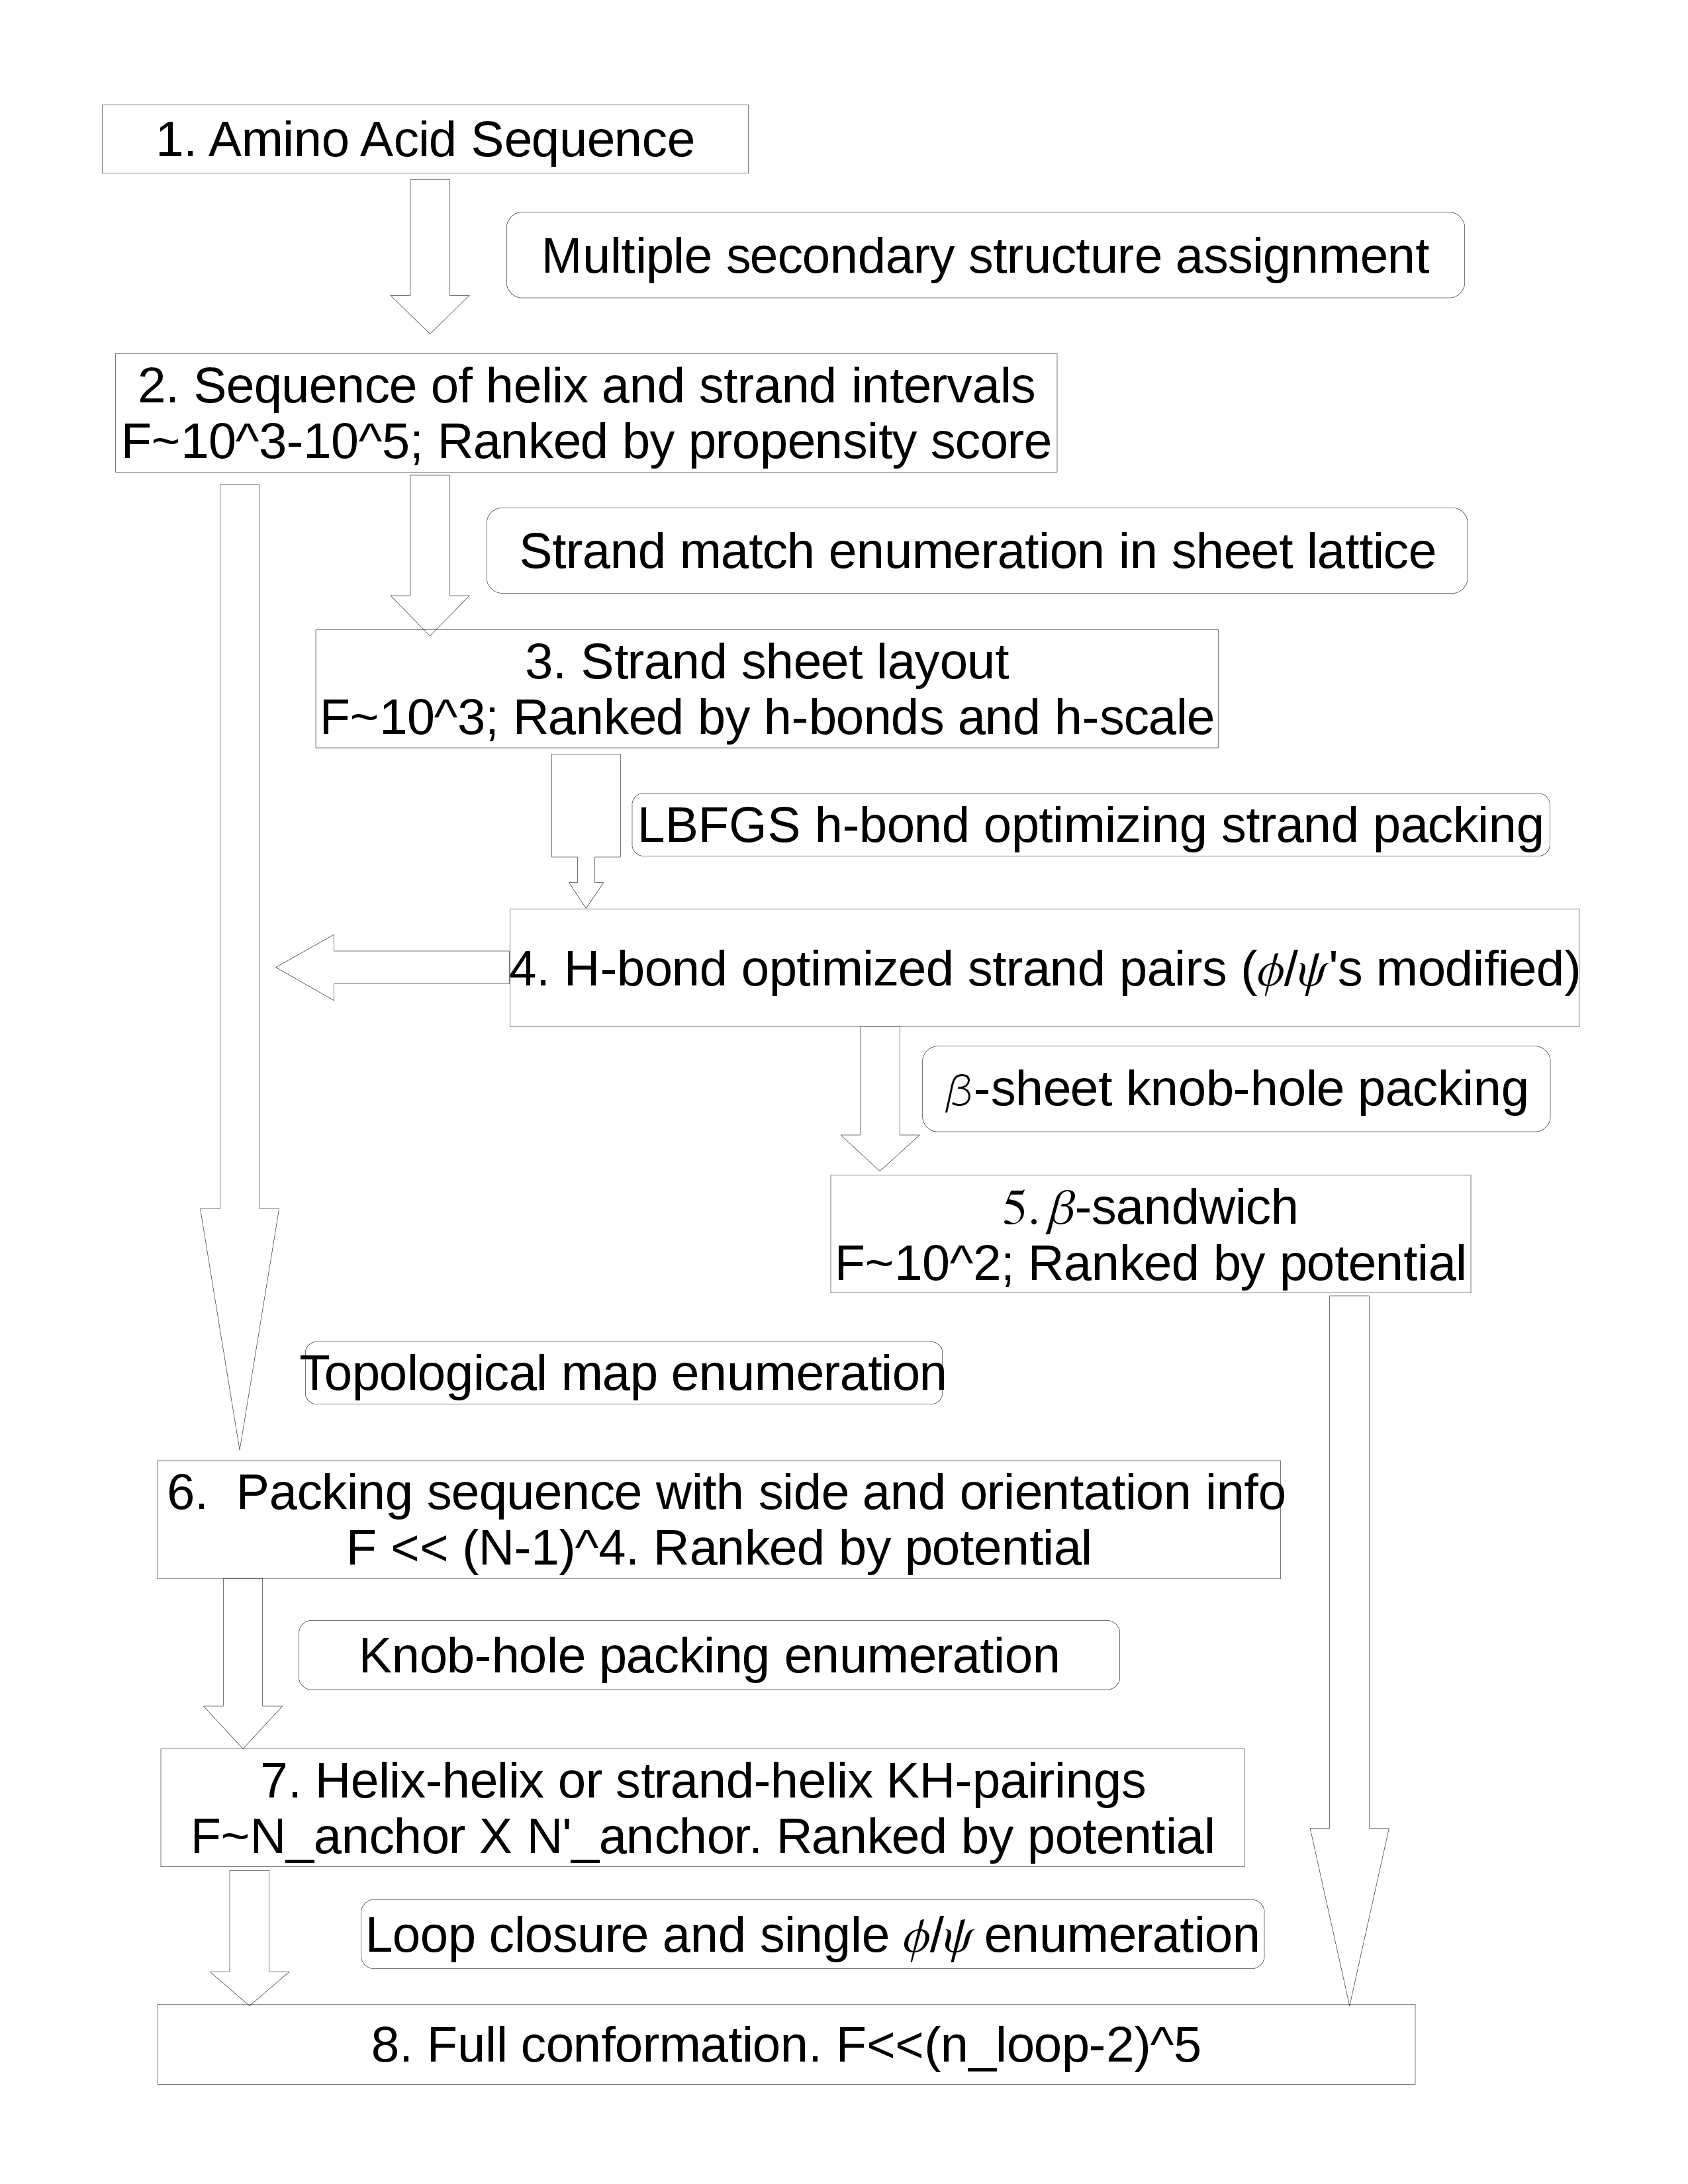
In fig.3 box 2, each PDB sequence is segmented into helix and strand intervals according to the residue propensities for α, β or coil. Alternative ways of segmenting are applied, thus multiple secondary structure assignments. Each segmentation is scored by the number of residues whose secondary structure designations are consistent with their propensities.
An all-helix assignment goes straight to box 6. An α-β assignment will first go to boxes 3 and 4. After enumerating the strand layouts and the h-bonds are optimized, each resulting sheet is sent to 6. At this step, there is not enough geometric detail for ranking by exact potential. But geometric constraints with energetical consequences can be applied.
At box 7 the topological map is expanded into refined knob-hole packing. In box 8, the loops are added.
| PDB | Chain | Number | Numbers | Core RMSD | Core | Conf | Refer- | ||
| ID | length | of core | of helices | w. native | RMSD | RMSD | ence | ||
| residues | & strands | param. | . | RMSD | |||||
| 2MHR | 118 | 73 | (4 0) | .910 | 1.361 | 2.300 | – | ||
| 1NKL | 78 | 56 | (5 0) | – | 1.777 | 2.522 | 3.836 | ||
| 1ECA | 136 | 112 | (8 0) | – | 3.010 | 3.236 | – | ||
| 1MBC | 153 | 119 | (8 0) | – | 2.122 | 3.283 | – | ||
| 1CTF | 68 | 57 | (3 3) | 1.900 | 3.145 | 3.787 | 4.438 | ||
| 4FXN | 138 | 89 | (4 5) | 1.890 | 3.477 | 4.700 | – | ||
| 8DFR | 186 | 99 | (5 8) | – | 4.557 | 5.408 | – | ||
| 1PLC | 99 | 48 | (0 8) | – | 3.050 | 4.550 | – | ||
| 1REI | 107 | 49 | (0 9) | – | 3.650 | 4.750 | – | ||
Results
Nine pdb sequences, representing α,β and α-β structures, are selected for experimenting with Upbuild, the enumeration program. To get a more definite comparison, we use both RMSDs and potentials as the criteria for the program performance.
Table 1 shows the closest RMSDs of generated conformations for near native secondary structure assignments. Here all RMSDs are achieved with model strands and helices, including the column labeled ”Core RMSD w. native param”, where the packing parameters, i.e., the translation and the rotations are extracted from PDB structures. The column ”Core RMSD” shows the result with the KH-packing (Knob-hole packing) enumeration. The column of ”Conf RMSD” indicates the RMSD for the full conformation. The ”Reference RMSD” column is for the minimum RMSD values reported in the decoy database from Levitt’s lab. (” Decoys R Us: A database of incorrect conformations to improve protein structure”, Ram Samudrala and Michael Levitt, Protein Sci, 2000, vol 9, 1399-1401).
| PDB | Chain | Native | Native | KH-Enum | KH-Enum | KH-Enum | Ref. | Ref. |
| ID | length | cutf=9 | cutf=9 | MD | cutf=9 | |||
| 1NKL | 78 | -2404.51 | -2417.85 | -2479.80 | -2542.20 | -2581.56 | -2448.40 | -2460.90 |
| 1CTF | 68 | -2079.14 | -2096.01 | -2100* | -2140* | -2223* | -2120.00 | -2142.22 |
| 4FXN | 138 | -4285.20 | -4321.20 | -4315* | -4382* | -4405* | – | – |
| 1PLC | 99 | -2950.23 | -2984.06 | -2979.90 | -2991.04 | – | – | – |
Diversity of the Conformations
Consider C ∈ Rm: C-α coordinates of a conformation, m = 3L, L: chain-length.
Each C represents a distinct conformation, separated by C-α RMSD ≥ 3.0A∘. Each conformation is minimized and has acceptable effective energy.
C0: C-α coordinates of the reference conformation.
P = C − C0: a point in the conformational space.
A∗ = [P1,P2,...Pn]: Sampling space determined by the set of distinct conformations.
Using Singular Value Decomposition to Evaluate the Diversity

.

.
![Σ = D ( σ1, σ2, .. σj , ... σm ); V = [v1, v2, ...vm ]](webpage22c2x.png)


V is Right singular vectors (RSVs) representing the composition of the space. Each column vector of U is a PC scaled by σ in principle component analysis (PCA) for the ”natural scaling”.
A singular value σj is significant if  ≥ δ. Chosen
δ = 0.02.
Let J such that  ≥ δ ∧
≥ δ ∧ < δ.
< δ.
We call J the effective dimension, a measure of diversity.
Because of the oversampling or undersampling of regions of the space, an iterative procedure need to be applied to maximize J.
The result is shown in table 3 for 1NKL, chain length L = 78, full dimension m = 234.
| Structure Type | No. of Distinct | Effective |
| of conformations | Conformations | Dimension |
| Native | ||
| Secondary Structre | 1200 | 159 |
| Helix Only | +3675 | 179 |
| α-β | +2995 | 205 |
| 2-Sheet | +550 | 206 |
| α-β | +1772 | 208 |
| Reference | 11660* | 195 |
Feasibility of Approximating
the Partition Function
Partition function for an ensemble with a quantized interaction potential: Q = Σg(h)e−𝜖h∕kT.
g(h) decreases exponentially with h. But the weight e−𝜖h∕kT increases exponetially with h.
If a sequence has a unique structure, then the most probable species, with highest h, dominates Q. Even if it does not, several high h levels combined may still dominate Q.
Question: How many levels down from hmax should we collec conformations to approximate Q?
Using a residue grain-size resolution, quantized potential, lattice geometry and with simplifying assumptions about g(h) behavior, it can be shown that only two more levels of conformations need to be collected to approximate Q to within 2% error. This may have implications for ensembles of realistic protein conformations.